Economic Forces Behind the Push for Standardized Payout Structures in Licensed Gaming Facilities
Written by Morgan Perry · Jun 20, 2026
Economic Forces Behind the Push for Standardized Payout Structures in Licensed Gaming Facilities
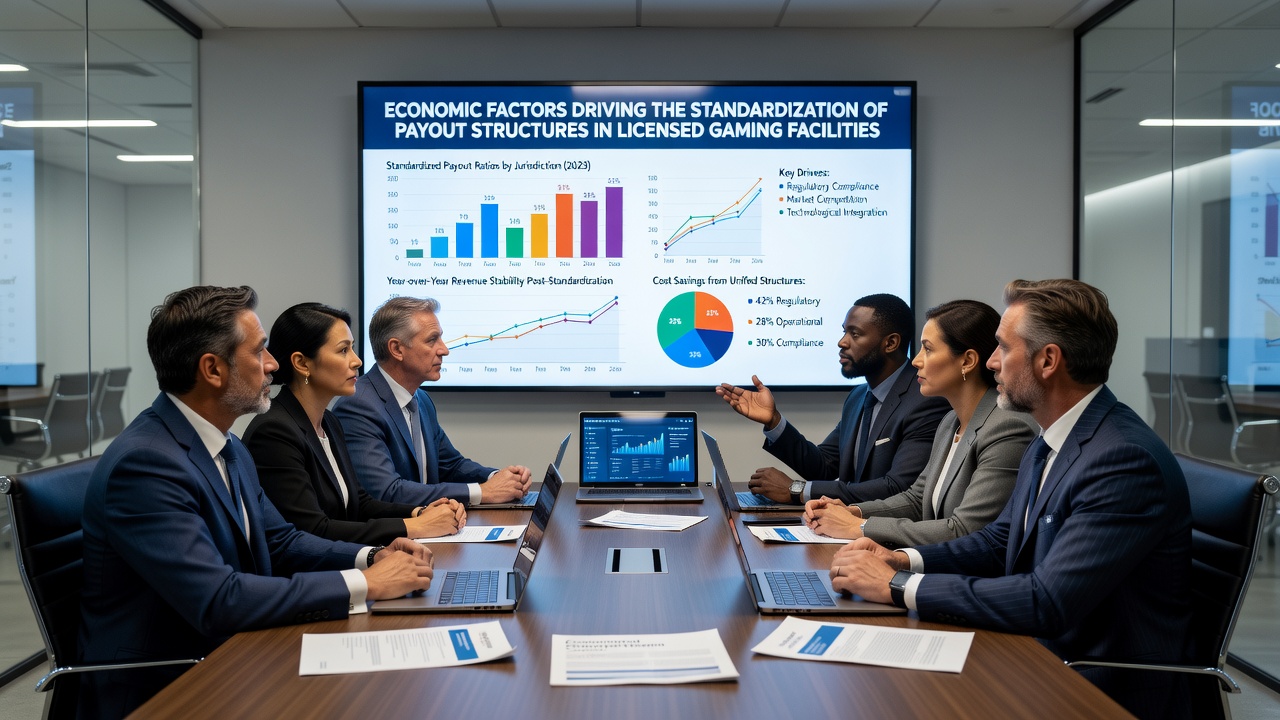
Market competition and revenue optimization continue to shape how licensed gaming operators approach payout structures, with economic pressures creating a push toward greater uniformity across jurisdictions. Operators face rising costs in technology, compliance, and player acquisition, factors that encourage consistent return-to-player percentages and standardized bonus frameworks to maintain profitability while meeting regulatory expectations.
Regulatory Economics and Compliance Costs
Regulatory frameworks impose direct economic constraints on payout variability, since licensing authorities require minimum return rates to ensure fairness and long-term operator viability. Data from the Nevada Gaming Control Board shows that facilities must balance these minimums against operational overhead, which includes taxes that can reach 6.75 percent on gross gaming revenue in certain categories. Those who've studied this landscape note how higher compliance expenses push operators toward predictable payout models that simplify auditing and reduce the risk of penalties.
Similar patterns appear in other regions, where revenue-sharing agreements with governments create incentives for standardized structures that facilitate easier reporting and tax collection. Researchers have documented cases where operators adjusted payout schedules after new tax tiers took effect, demonstrating how fiscal policy influences operational decisions across multiple markets.
Competitive Pressures in Saturated Markets
Intense competition among licensed venues drives further standardization, because players compare return rates across platforms and migrate toward those offering reliable value. Industry reports indicate that when one major operator raises its average return percentage to attract volume, competitors often follow suit within months to protect market share. This dynamic creates de facto benchmarks that smaller facilities adopt to remain viable.
Observers note that loyalty programs and bonus structures have also converged around common percentages, since deviating too far from established norms risks losing high-value players to rivals. The reality is that marketing departments rely on these standardized figures to craft comparable offers, reducing the cost of constant reinvention while still competing on service quality and amenities.
Technological Advancements and Data Analytics
Advanced analytics platforms allow operators to model payout impacts with precision, leading to more uniform structures that maximize long-term revenue. These tools process player behavior data in real time, identifying optimal return rates that balance session length with house edge. Facilities investing in such systems often converge on similar configurations because the underlying algorithms prioritize the same efficiency metrics.
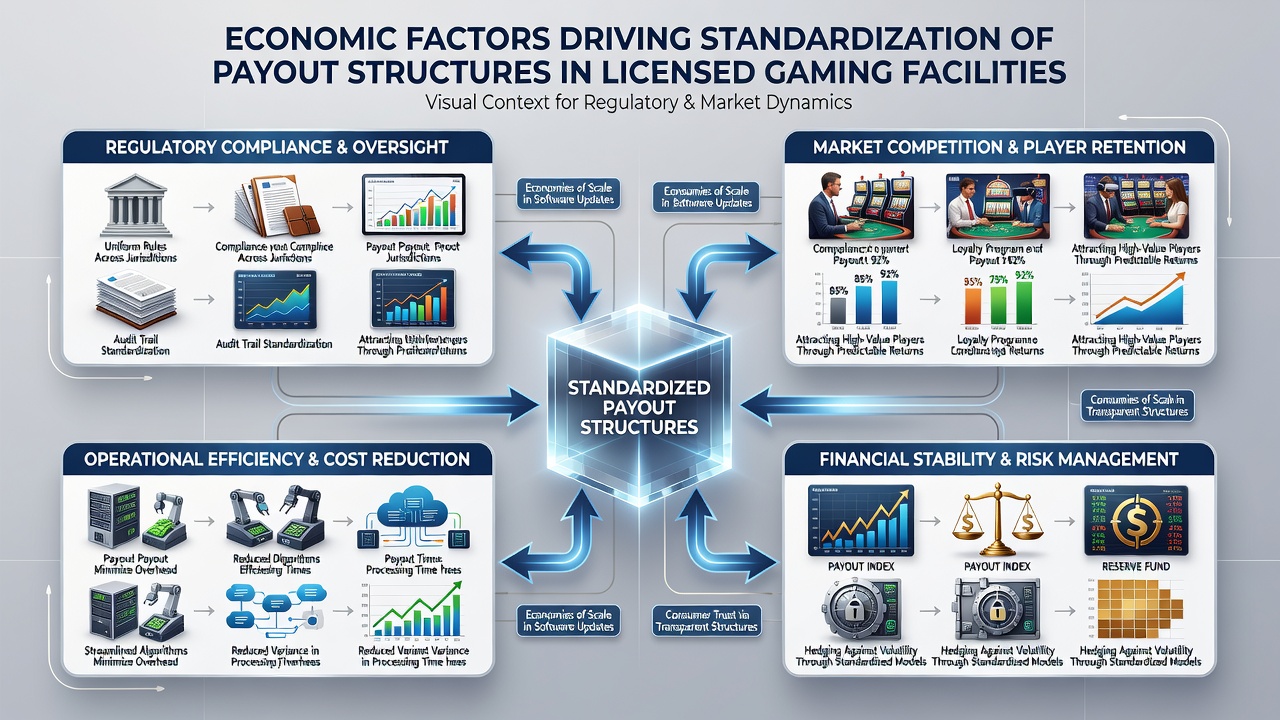
Software providers serving multiple clients contribute to this trend by offering standardized modules that comply with various licensing requirements simultaneously. As a result, operators across different jurisdictions end up using comparable payout engines, which reduces development costs and accelerates deployment. Figures from industry associations reveal that facilities adopting these shared platforms report lower variance in their average returns compared with those maintaining custom systems.
Global Market Integration and Cross-Border Influences
International expansion by major gaming groups accelerates standardization because corporate strategies favor consistent payout policies across properties. When a company operates venues in multiple countries, it applies unified economic models to simplify financial forecasting and investor reporting. Economic studies highlight how currency fluctuations and cross-border player traffic further encourage aligned structures that minimize confusion for international visitors.
Trade organizations have compiled data showing gradual convergence in average return percentages across North American and Australian markets over the past decade. This alignment stems partly from shared supplier networks and partly from investor expectations for predictable performance metrics. Those monitoring these trends point to upcoming regulatory reviews scheduled for June 2026 as potential catalysts for additional harmonization in several jurisdictions.
Player Retention Economics and Behavioral Patterns
Retention costs represent another significant driver, since operators must allocate substantial budgets to bonuses and promotions that align with standardized payout expectations. Research from academic institutions indicates that players respond more favorably to transparent, consistent return rates than to fluctuating ones, reducing churn and associated acquisition expenses. This behavioral response reinforces the economic logic behind uniformity.
Facilities that deviate significantly from prevailing payout norms often experience higher marketing costs to compensate for perceived differences. The ball's in their court when deciding whether to invest in education campaigns or simply adopt the standards that competitors have already established.
Conclusion
Economic factors ranging from regulatory taxes and competitive dynamics to technological efficiencies and global expansion continue to influence payout standardization in licensed gaming facilities. Data indicates these pressures produce measurable convergence in return structures across regions, with further adjustments likely as new compliance requirements emerge in 2026. Industry participants track these developments closely because the resulting models directly affect both operational sustainability and market positioning.